Structured data production capability behind the research and insights team.
Designed for teams that need reliable delivery, clean process structure, and a stronger data production layer during demanding studies, recurring trackers, or heavy periods.
Survey Data Structuring
- Dataset cleaning and transformation
- Derived variables and recodes
- Multi-punch and multi-response handling
- Weighting setup and application
- Validation and consistency checks
Cross-tabs and Structured Outputs
- Cross-tabs and banner tables
- Top / bottom box summaries
- Statistical summaries where required
- Custom subgroup and segment cuts
- Client-ready datasets and tabulation outputs
Excel Review and Dashboard Add-Ons
- Pivot-based dashboards
- Slicers and filters
- Simple stakeholder-facing navigation
- Useful supplement to traditional tables
Workflow and Data Production Support
- Repeatable study setup logic
- QC and validation structure
- Process standardization
- Production-oriented workflow improvement
| Overflow support | Additional production capacity when internal teams are at limit and survey data work starts to bottleneck. |
| Complex studies | Useful when survey structure, weighting, or reporting requirements become more demanding than expected. |
| Recurring work | A fit for trackers or repeated study types where consistency matters across waves. |
| Workflow improvement | Helpful for teams that want cleaner, more repeatable data production methods. |
Outputs prepared for client use
Deliverables consist of clean datasets, cross-tabs, and reporting outputs prepared for client teams. Internal production systems and workflow methods remain part of the underlying service.
Operating approach
Production work is handled with emphasis on consistency, validation, and structured outputs that hold together under real project pressure.
Consistent Production
Structured workflow designed to produce reliable and repeatable outputs across studies.
Clear Validation
Base checks, frequency reviews, and structural validation applied before delivery.
Client-ready Outputs
Deliverables prepared for direct use in reporting, analysis, or presentation environments.
Optional dashboard outputs
Interactive Excel-style views can be prepared as an additional reporting layer alongside tables and core outputs.
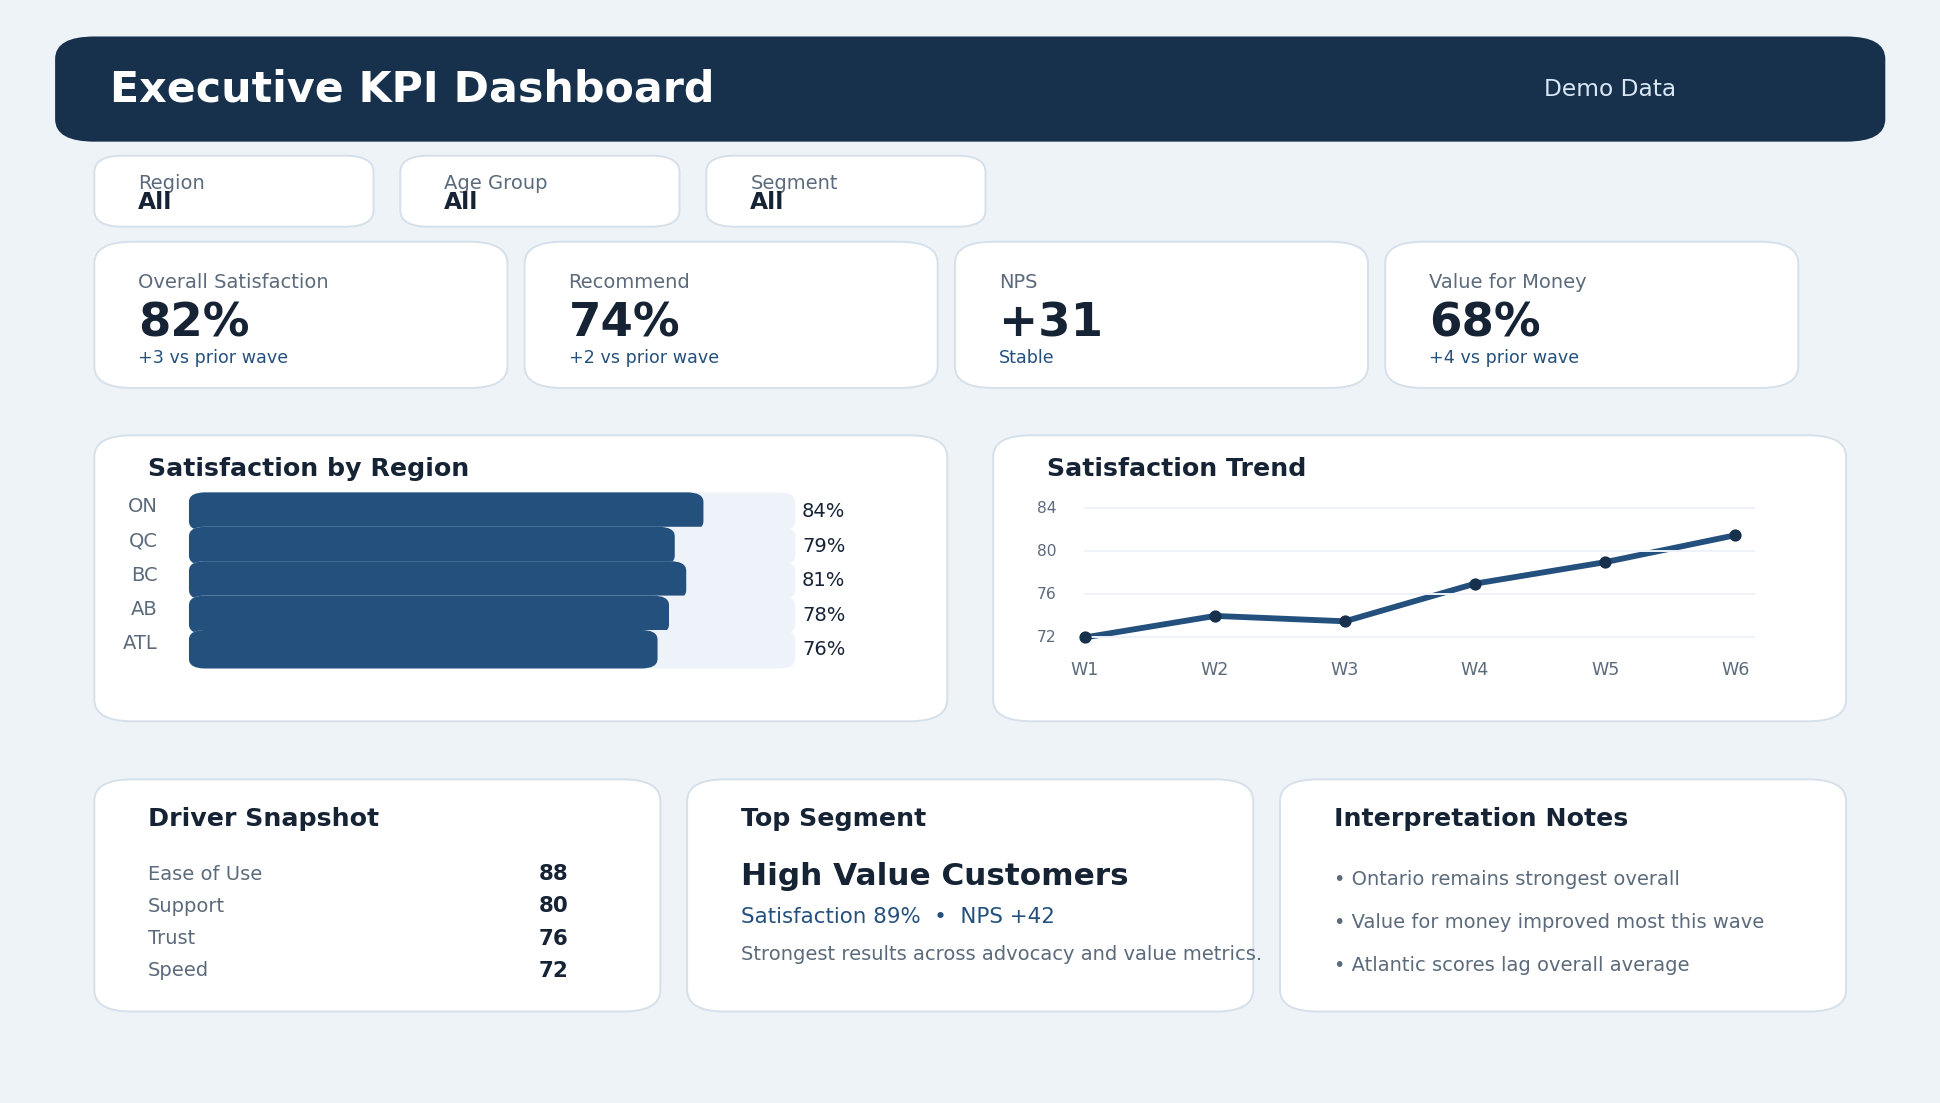
Executive summary view
Suitable for headline KPI reporting and quick performance review.
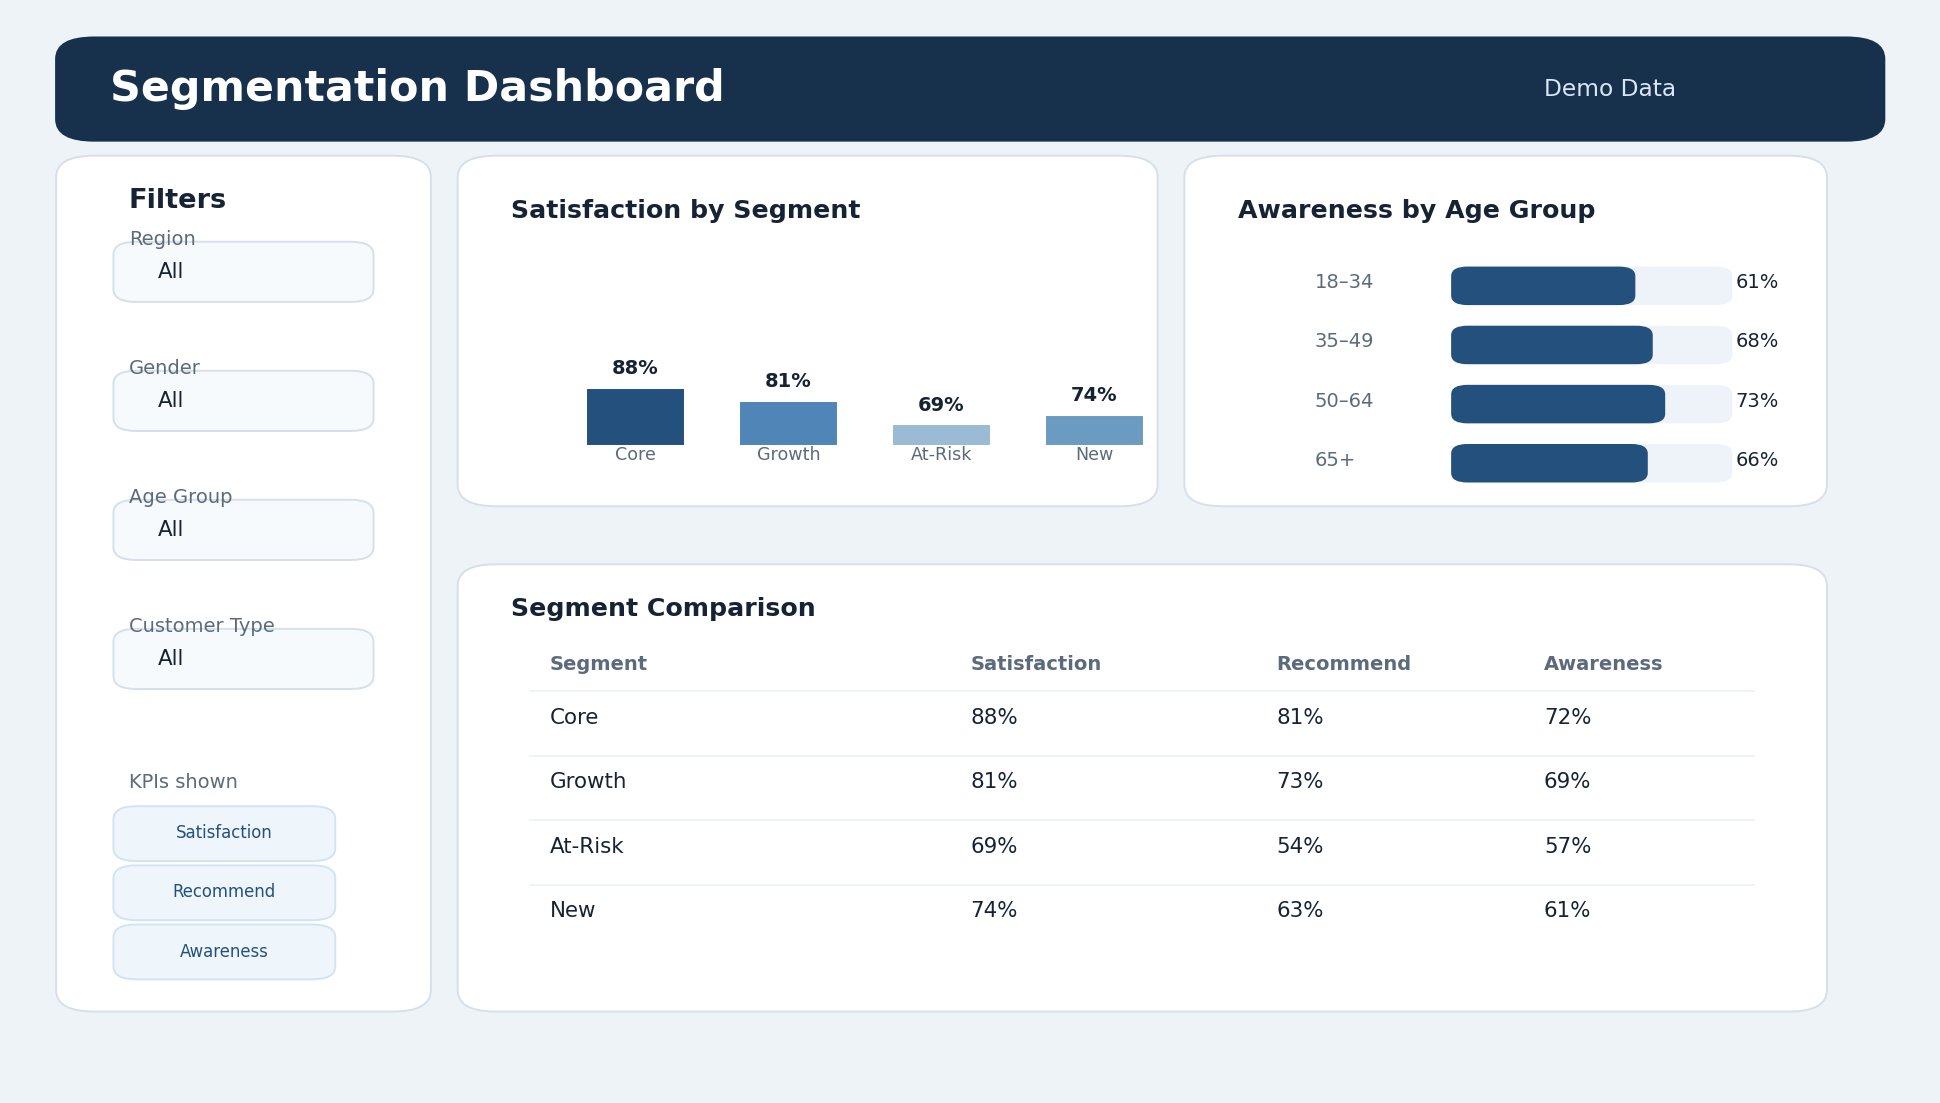
Segment comparison view
Useful for filterable review by audience, region, or demographic cut.
Common dashboard formats
Five compact layouts cover most survey dashboard requirements without overcomplicating reporting.
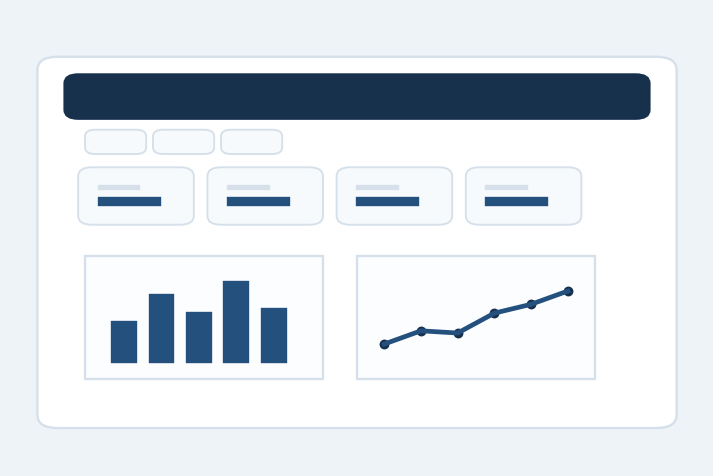
Executive KPI Summary
Headline metrics, trend indicators, and top comparisons for quick review.
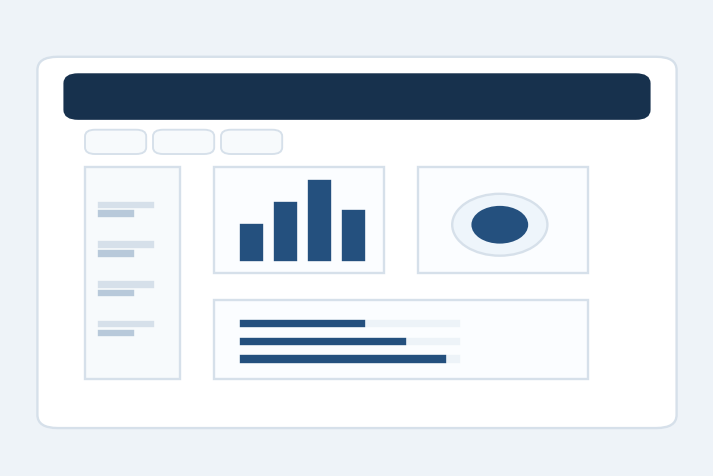
Segment Comparison
KPIs compared across audience, customer, or stakeholder groups.
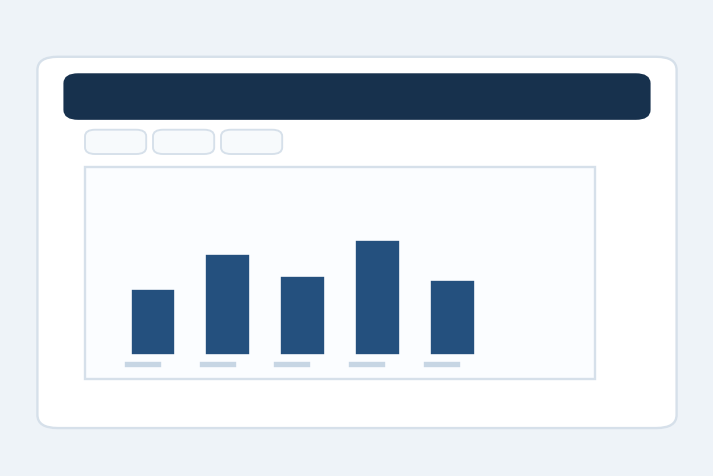
Regional Comparison
Performance viewed by region, market, location, or business unit.
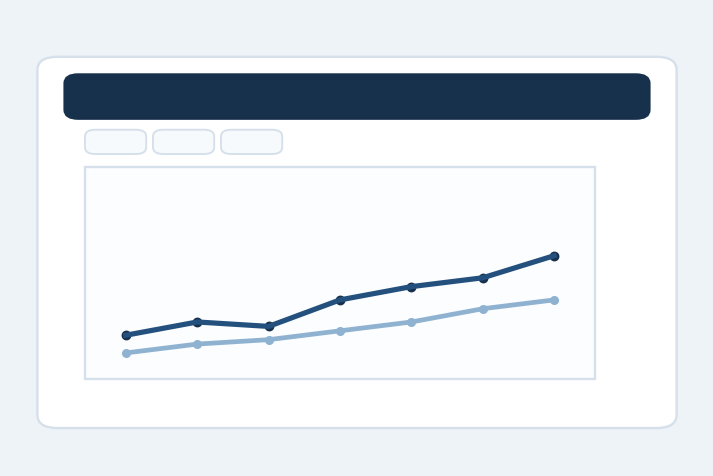
Tracker / Trend View
Wave-to-wave or period-over-period movement in key measures.
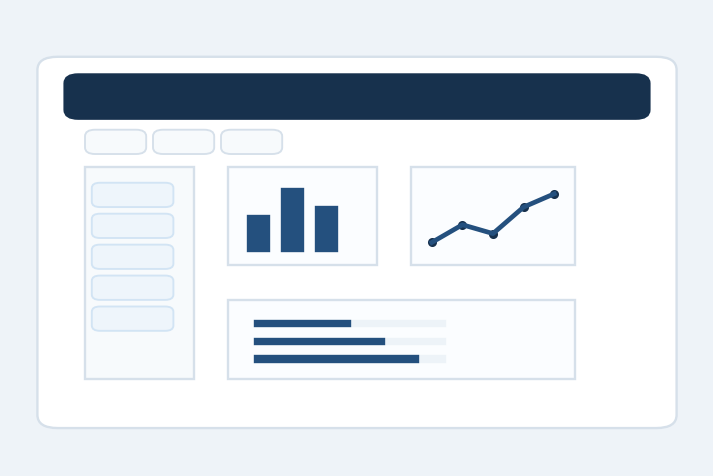
Detailed Explorer
Filterable exploration for teams that want deeper slice-and-dice review.