A structured data production layer for complex survey and insights work.
Built to support research and insights teams when survey data becomes complex, internal bandwidth is tight, or execution requirements move beyond standard workflows.
What this supports
The work sits behind the research process, handling the data production layer rather than the front-end narrative.
Data structuring
Raw survey exports are cleaned, structured, and aligned to reporting logic so teams have a dependable base for analysis.
- Cleaning and transformation
- Derived variables and recodes
- Multi-response handling
- Weighting implementation
Cross-tab and reporting outputs
Repeatable tables and summaries prepared for reporting environments, internal review, and ongoing study delivery.
- Banner tables
- Top and bottom box summaries
- Means and key summaries
- Subgroup and segment cuts
Excel and structured review layers
Deliverables can extend beyond standard tables when teams need practical Excel-based review tools or more flexible outputs.
- Pivot and slicer outputs
- Dashboard-ready structures
- Client-ready Excel files
- Optional visual layers
Where this is typically useful
Most often used when survey data becomes too large, too awkward, or too time-sensitive for a standard internal flow.
When internal teams are at capacity
Additional production support can keep delivery moving without forcing analysts or researchers to absorb technical data execution work.
When survey structure gets demanding
Useful for multi-segment studies, awkward questionnaire logic, trackers, weighting, and more complex output requirements.
When repeatability matters
Well suited to recurring work where output structure, naming, and validation discipline need to hold together wave after wave.
When teams need more than static tables
Output can include clean datasets, significance-tested tables, pivot-ready Excel, and structured review layers.
Typical deliverables
Prepared for direct use by research teams, insights teams, and client reporting environments.
Clean structured dataset
Validated dataset prepared for analysis and reporting, structured consistently with survey design and delivery needs.
Cross-tab tables
Banner tables and structured outputs supporting demographic, segment, and subgroup analysis.
Summary tables
Top box, bottom box, mean, and key statistical summaries required for reporting.
Segment breakouts
Outputs for stakeholder groups, customer segments, and audience categories.
Excel deliverables
Clean Excel tables or structured sheets suitable for reporting and internal exploration.
Structured review views
Excel-based views for teams that want a more flexible review layer without changing how work is delivered.
Sample dashboard views
Examples of optional Excel-style dashboard outputs using demonstration data.
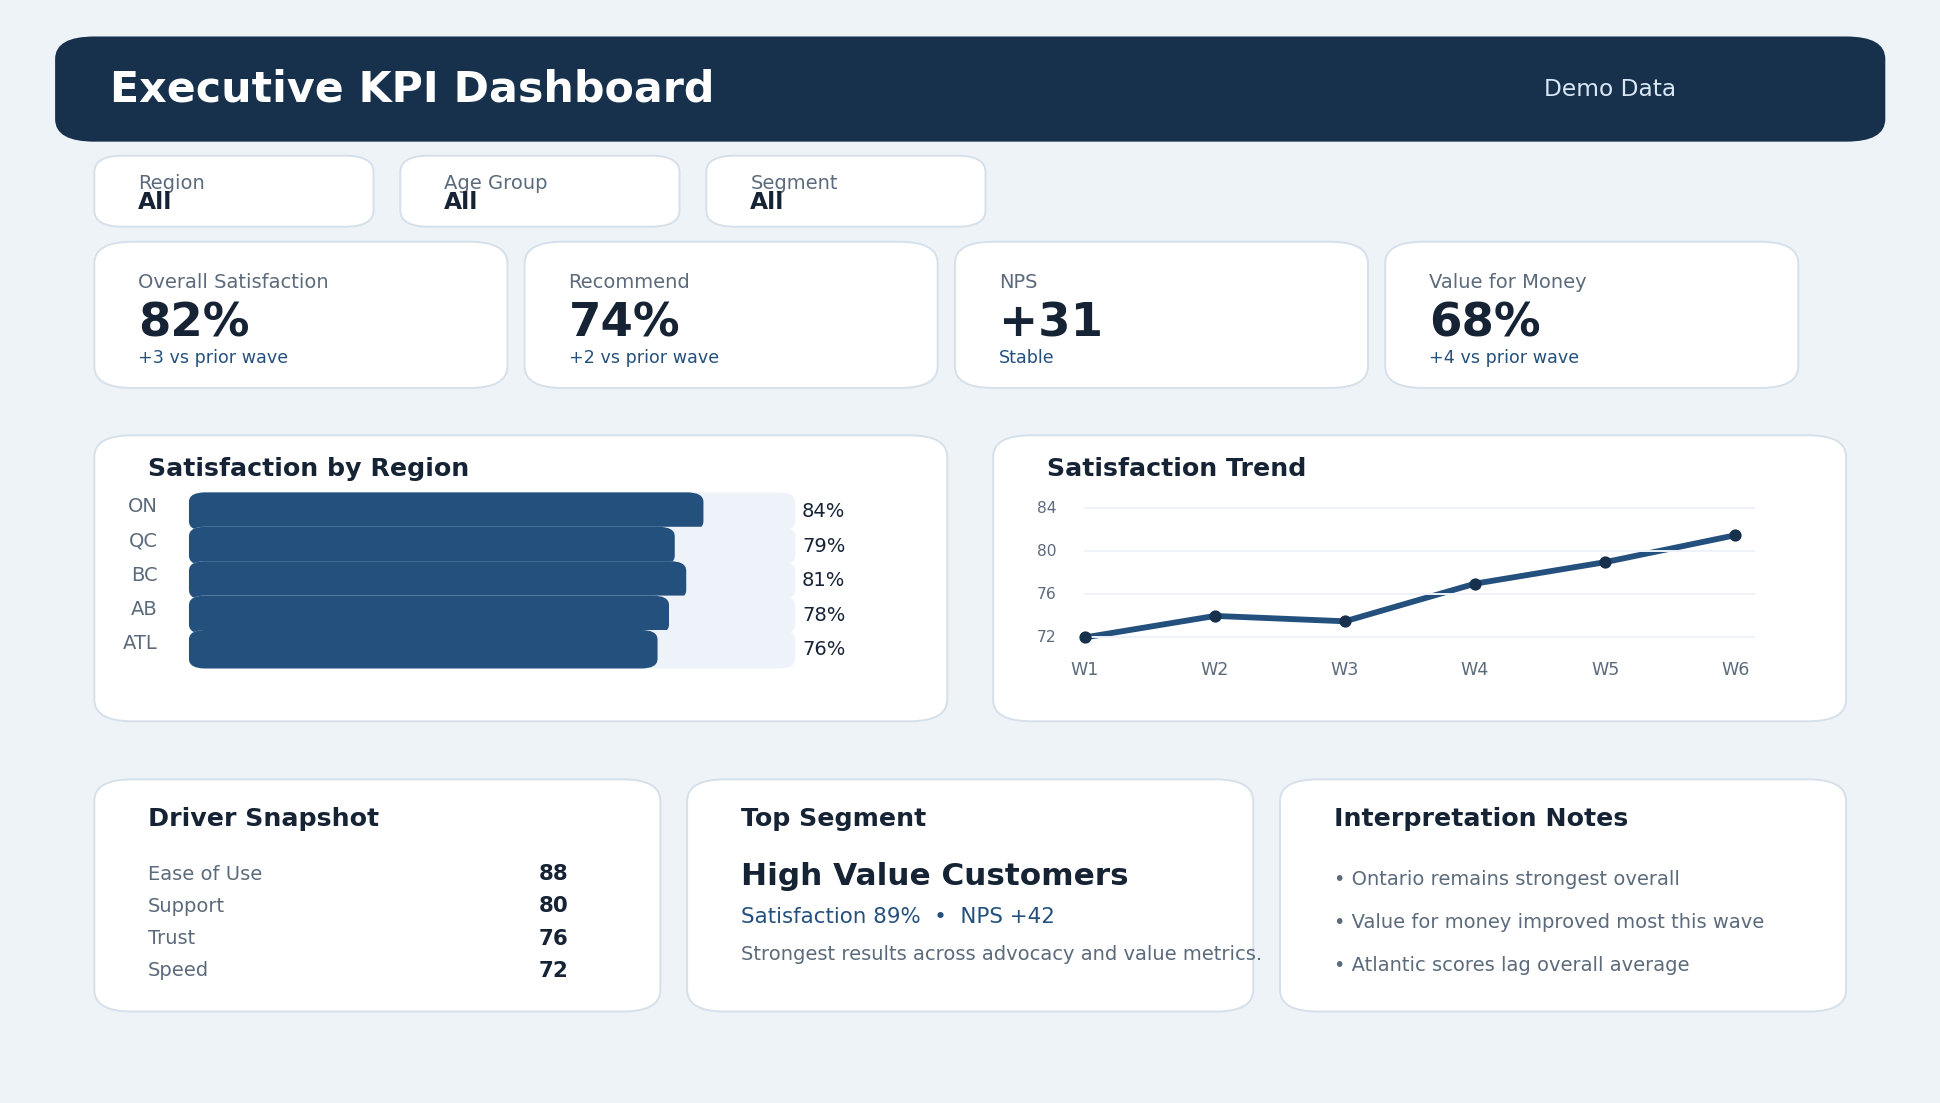
Executive KPI dashboard
A compact summary view showing headline metrics, regional comparisons, trends, and interpretation notes.
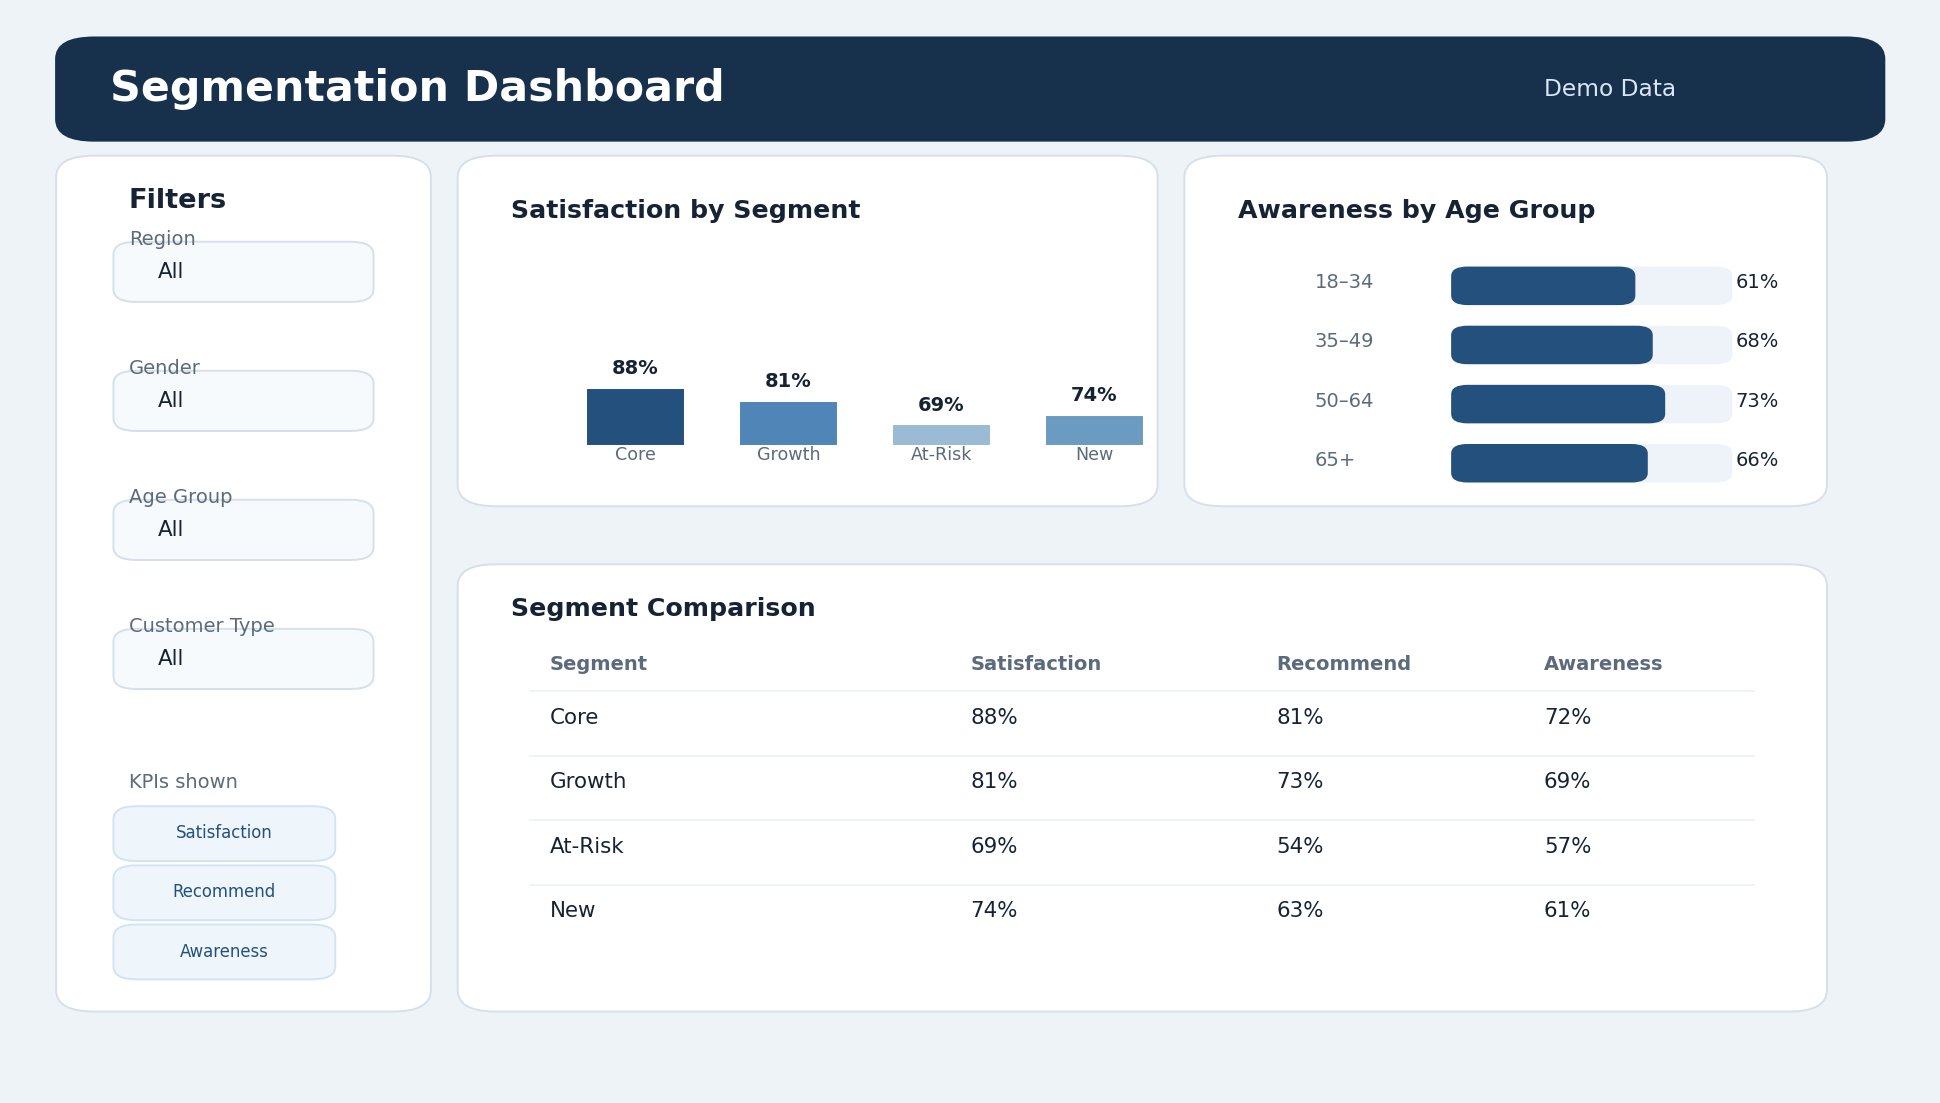
Segment comparison dashboard
A structured dashboard view for comparing survey KPIs across segments, demographic groups, and filters.
Need a reliable data production layer behind your next study?
Use the inquiry form to outline the study, timing, and where support is needed. Contact remains structured through the site form so nothing gets lost in the shuffle.